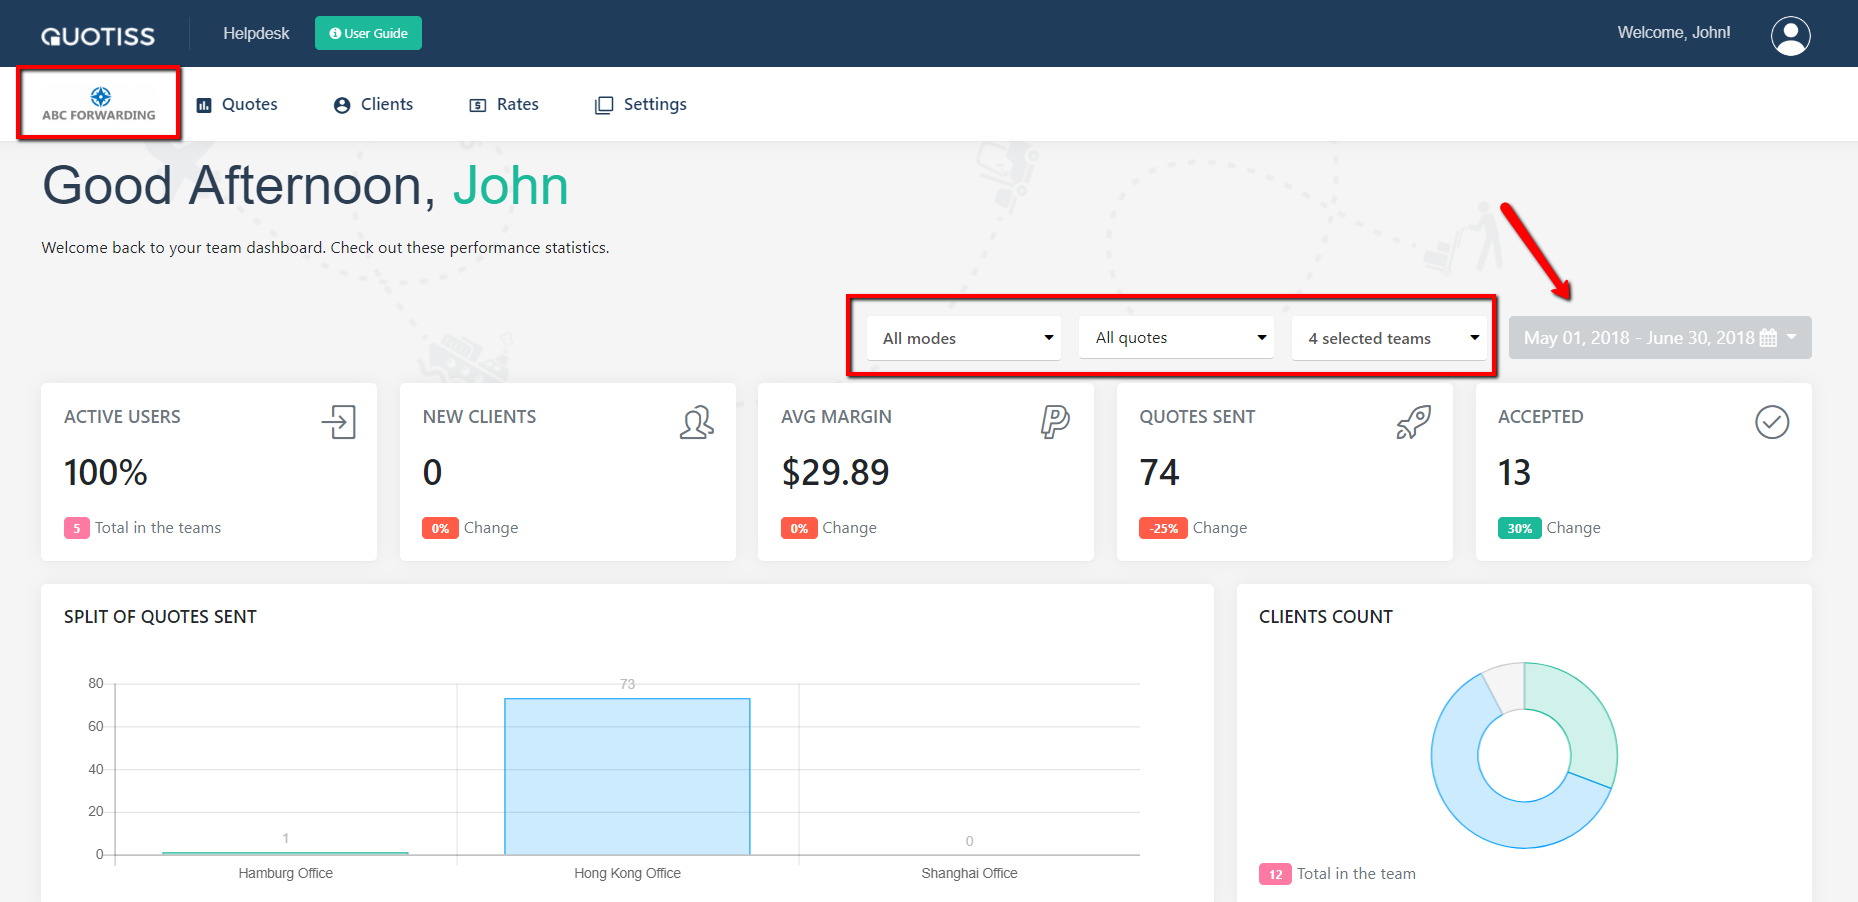
The dashboard is a powerful and visual analytics module of Quotiss. You can monitor performance of the sales teams, amount of sent / accepted quotes, average profit margins, etc
In order to access the Dashboard, click on the logo at the top left corner:
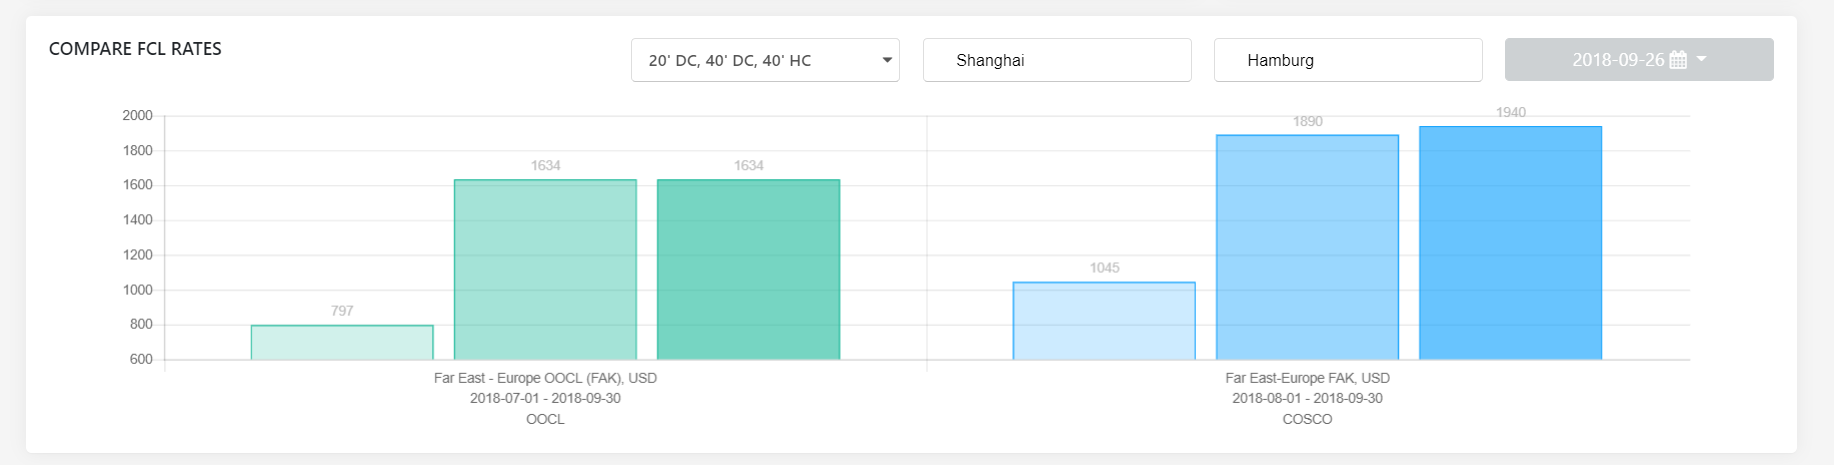
You can also compare the available FCL rates on the dashboard by selecting the necessary equipment type and port pair:
The administrator can export the data from the dashboard to the Excel file:

Helpful tip - Use filters to drill down the performance metrics.